
September 18, 2026
APEXlang vs SQL Deployment: The Network Path Determines the Winner
APEXlang and SQL imports trade database work for network trips. Tests from a local VM, across a VPN, and near an OCI database show when each is faster.

Two cats today
In my last post, I introduced a simple rule: every post gets a cat photo, and a particularly important post gets two cats. Both are here today, so you know how I feel about this one.
That second cat points to a question I think matters: When deploying an APEX application, should we import APEXlang files or run the conventional SQL export? SQLcl Project 26.2.2 now gives us both options in a Project deployment. I call them the APEXlang import and the SQL import throughout this post. To find out what makes one faster, I timed the direct SQLcl import commands and wrote a rather detailed technical article about the tests.
I also installed Google Analytics on this site. Sorry if you did not want to be tracked, but it was for your own good, okay? It tells me the average engagement time on this blog is 29 seconds. If that sounds like you, here is the short version.
TL;DR
-
To find out what was going on, I traced both imports in the database and examined them with TKPROF. They create much the same APEX components, but APEXlang made about five times fewer trips between SQLcl and the database while making about three times as many database calls and spending about twice as much time on database SQL work. That made me suspect the network might decide which one was faster, while database load might matter for a very large or parallel deployment.
-
It did. When I connected from my workstation over a VPN to an OCI database, APEXlang won at every application size I tested. When I ran SQLcl from an OCI compute node close to that same database, SQL was significantly faster for the larger applications. At 314 pages, the nearby SQL and APEXlang imports took 5.5 and 14.5 seconds; over the VPN, they took 56 and 35 seconds. The route from SQLcl to the database mattered more in these tests than the database’s size.
-
I also checked whether SQLcl needs ORDS to import APEXlang. It does not: SQLcl includes the APEXlang compiler and imports over its database connection even when ORDS is stopped. SQLcl also appears to reuse APEXlang compiler work within the same SQLcl session. In a separate validation test, running smaller applications before larger ones saved 22% against the reverse order. For SQLcl Project, I would put smaller applications first in
dist/releases/apex/apex.changelog.xml, the file that controls their deployment order. -
I built a downloadable test kit with the scripts and logs, so you can try this in your own environment. I enjoyed building it almost as much as running the tests.
If you want to see how I arrived here, including the charts, tables, and a few surprises, stay with me. If you have only 29 seconds, jump to Conclusions and recommendations for the choices I would make from these tests.
Table of Contents
- The small toolkit behind the numbers
- Looking under the hood: what the database trace showed
- Does an APEXlang import need ORDS?
- When the network changed the winner
- Finding the price of APEXlang compilation
- Acknowledgements
- Conclusions and recommendations
- Sources
The small toolkit behind the numbers
All the scripts below are in the APEXlang versus SQL test project. Its zip/ folder also contains a complete ZIP to download to your workstation.
Before I could compare imports, I needed two things: a way to time a whole import and a way to change the same application’s size without building or deleting hundreds of pages by hand. Both turned out to be more interesting than I expected.
One timer for the whole import
My first thought was SET TIMING ON. It was not quite the tool for this job. SQLcl printed no total time after apex import, and when I imported the SQL export file, it printed a separate time for each statement. That is useful when investigating one statement, but it does not answer, “How long did the application take to import?”
I wrote two SQLcl aliases instead: test_al_load for the APEXlang import and test_sql_load for the SQL import. Each asks the database for the time before and after the import and prints one elapsed time. The aliases also make the test script shorter: the runner can call the same named commands for every application size.
Here is the complete test_al_load definition from the alias file. The SQL import alias uses the same timing pattern around its @ command:
<alias name="test_al_load">
    <description>Import an APEXlang application folder and report elapsed time.</description>
    <queries>
        <query minversion="19">
            <sql><![CDATA[set define on
set verify off
set timing off
column apexlang_path new_value apexlang_path noprint
select :apexlang_path apexlang_path from dual;
column started_at new_value started_at noprint
select (sysdate - date '2026-01-01') * 86400 as started_at from dual;
prompt Importing APEXlang application from &apexlang_path. ...
apex import -input &apexlang_path.
set verify off
set define on
select 'Elapsed time: ' || to_char(
                     (sysdate - date '2026-01-01') * 86400 - &started_at
                 , 'FM999999990D000') || ' seconds' as elapsed_time
    from dual;
set define off
]]></sql>
            <binds>
                <bind id="apexlang_path">
                    <tooltip><![CDATA[Path to the APEXlang application folder.]]></tooltip>
                </bind>
            </binds>
        </query>
    </queries>
</alias>
The path arrives as the bind variable :apexlang_path. The first SELECT copies it into SQLcl’s &apexlang_path substitution variable, which the apex import command can use. The two SYSDATE queries then bracket the import.
From the extracted test kit, I loaded the aliases in a connected SQLcl session. Here is the APEXlang command with selected output; I have omitted SQLcl’s blank lines and row-count messages:
SQL> alias load scripts/xml/stel-timing-aliases.xml
Aliases Loaded
SQL> test_al_load  src/database/demo1/apex_apps/f106/demo1
Importing APEXlang application from src/database/demo1/apex_apps/f106/demo1 ...
Importing application ID: 106 into workspace: DEMO1
Import successful.
ELAPSED_TIME
------------------------------------
Elapsed time: 2.000 seconds
The SQL import alias takes the exported script’s path with or without its .sql extension. Here is its command and selected output; I have omitted the middle application-component lines, plus SQLcl’s blank lines and row-count messages:
SQL> test_sql_load  src/database/demo1/apex_apps/f106/f106
Running SQL script src/database/demo1/apex_apps/f106/f106 ...
--application/set_environment
APPLICATION 106 - EMP & DEPT Mini Hub
[application-component lines omitted]
--application/end_environment
...done
ELAPSED_TIME
------------------------------------
Elapsed time: 3.000 seconds
These timers include time spent in SQLcl and between SQLcl and the database, which is exactly the elapsed time I wanted to compare. They use SYSDATE, so the result is accurate only to whole seconds; the .000 is formatting, not millisecond precision.
I also wanted to time apex validate while SQLcl was running as sql -nolog, with no database connection. That ruled out the import aliases.
No database, no timing alias
SQLcl passes a parameterized alias argument as a bind variable. My alias needs
SELECT ... FROM dualto copy that bind into a defined substitution variable (&apexlang_path) that theapexcommand can use. With no database connection, I cannot run thatSELECTor ask the database for a timestamp. So I cannot use these timing aliases here, althoughapex validateitself still works.
Instead, I used a SQL script with a positional &1 argument for the path and operating-system commands for the clock. This is the timing fragment from the step script; the page-count adjustment runs before the first timestamp and appears in the next section:
define apexlang_path=&1
! bash -c "date +%s >/tmp/start_time"
apex validate -input &apexlang_path.
! bash -c "echo \"Elapsed $(($(date +%s) - $(cat /tmp/start_time))) seconds\"; rm /tmp/start_time"
From the extracted test kit, I ran the validation runner with 0, 300, and 600 extra pages. This is its command and selected output from the first validation; the page-file messages and blank lines are omitted:
$ scripts/run_apex_validate_nolog.sh 0 300 600
Validation 3 times for 0 pages
Validating APEXlang application from src/database/demo1/apex_apps/f106/demo1 ...
Validation successful.
Elapsed 12 seconds
The shell commands surround only apex validate; page cloning happens before the first timestamp. Like the alias, this timer counts whole seconds. It let me measure part of SQLcl’s local APEXlang work separately from a complete import.
Changing the application’s size in both directions
The starting application had 14 pages. To find out whether the answer changed with page count, I wrote a Python script with help from my AI coding assistant. It copies one APEXlang page, giving each copy a new page number, alias, and report ID. Here is the command for keeping ten generated copies of page 6, followed by selected output; the middle file lines are omitted:
$ python scripts/apex/clone_apex_page.py 6 10
Created demo1\pages\p02001-departments-2001.apx
Created demo1\pages\p02002-departments-2002.apx
[seven file lines omitted]
Created demo1\pages\p02010-departments-2010.apx
That 10 is the number of copies to keep, not ten more copies every time the command runs. If I already have 300 generated pages and run it with 10, the script removes 290 of those page files from disk; the application goes from 314 pages back to 24. I could move in either direction, testing 14, 24, 64, 114, 214, and 314 pages without rebuilding the application by hand. I have to admit, directly editing APEXlang files with a script was part of the fun.
A bigger win than the stopwatch
Editable APEXlang pages make tests like this practical. A small script can clone a page, update its identifiers, and grow or shrink an application whenever I need another size to test. I can extend the script for more involved pages, too. That gives me an easy way to automate repeatable scalability tests that I could not manage nearly as easily with a generated SQL export. It is a valuable APEXlang feature regardless of which deployment format imports faster.
The benchmark runner
I did not want to repeat the same sequence by hand at six application sizes. The Bash runner starts SQLcl, connects to a saved connection, selects the APEX workspace, loads the timing aliases, and starts the SQL test script. This is the part that ties those pieces together:
sql -nolog 2>&1 <<EOF | tee "$log_file"
conn -n $conn_name
exec apex_application_install.set_workspace('$workspace');
alias load scripts/xml/stel-timing-aliases.xml
@scripts/sql/apex_timing_test.sql
exit
EOF
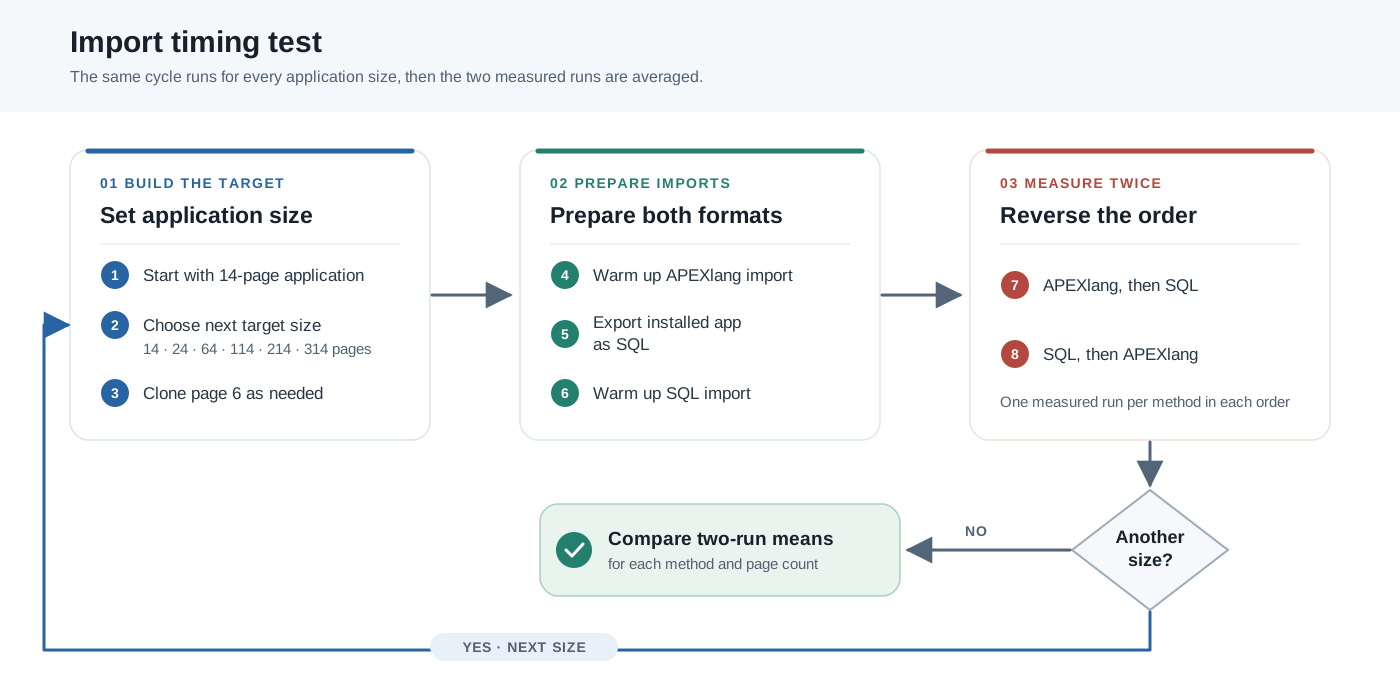
The SQL test script asks for 0, 10, 50, 100, 200, and 300 extra pages. At each size, its step script warms up the APEXlang import, exports the installed application as SQL so both formats have the same pages, warms up the SQL import, and then measures both methods twice in reversed order. I average those two measured runs. You may wonder why I did not just use SQLcl’s spool command. It misses output from OS commands called through ! or host, including the Python page-cloning command. To preserve that output alongside SQLcl’s, the runner redirects the whole process through tee into a log file.
From the extracted project’s root, I ran the local VM test with a saved connection named demo_vm26 and workspace demo1. Here is its command and selected opening output; I have omitted the banner, blank lines, and other variable lines:
$ scripts/run_apex_timing_test.sh demo_vm26 demo1
SQLcl: Release 26.2 Production on Thu Sep 10 22:01:48 2026
Connected.
Aliases Loaded
Confirming test variables
test_app_id    = 106
test_al_dir    = src/database/demo1/apex_apps/f106/demo1
The runner repeatedly replaces application 106. It also runs git clean -fd in the generated APEX paths before starting, so I use an isolated copy of the test project rather than a working tree with changes I want to keep.
The trace helper
Timing told me which import finished first. I also wanted to see what each method asked the database to do. The trace helper accepts APEXLANG or SQL, chooses the matching timing alias, enables session tracing, imports the application, disables tracing, and prints the trace-file path. These are the important lines from scripts/sql/apex_import_trace.sql; the variable setup and command selection are above this excerpt in the full script:
alter session set tracefile_identifier = '&trace_identifier';

begin
    dbms_monitor.session_trace_enable(
        waits => true,
        binds => false
    );
end;
/

&import_command

set define on
begin
    dbms_monitor.session_trace_disable;
end;
/

select value as trace_file
  from v$diag_info
 where name = 'Default Trace File';
The account running that script needs permission to call DBMS_MONITOR. I connected as DEMO1; for this test, a DBA granted it access:
grant execute on dbms_monitor to demo1;
I ran the APEXlang trace from a connected SQLcl session after loading the timing aliases. This is the command and selected output from a later 214-page run; SQLcl’s blank lines and row-count messages are omitted:
SQL> @scripts/sql/apex_import_trace.sql APEXLANG
Trace identifier: APEX106_APEXLANG_214P_20260917_150317
Session altered.
PL/SQL procedure successfully completed.
Importing APEXlang application from src/database/demo1/apex_apps/f106/demo1 ...
Importing application ID: 106 into workspace: DEMO1
Import successful.
ELAPSED_TIME
------------------------------------
Elapsed time: 8.000 seconds
PL/SQL procedure successfully completed.
TRACE_FILE
----------------------------------------------------------------------------------------------------------------------------------------------------------------
/opt/oracle/diag/rdbms/free/FREE/trace/FREE_ora_51445_APEX106_APEXLANG_214P_20260917_150317.trc
The path is on the database host, where I used TKPROF to turn the trace into a readable report. I reconnected before tracing the SQL import so each method had its own database session. The 8-second run above illustrates the helper; the comparison in the next section uses a different pair of trace reports.
Run the tests yourself
The repository linked at the start of this section has the scripts, logs, and a complete ZIP. On Windows, I used Git Bash; the tools also ran on Oracle Linux 9. You will need Git, Bash, Python 3.9 or later, and SQLcl 26.2. Import tests need a saved SQLcl connection, APEX 26.1 or later installed in a compatible database, and access to the test workspace. For APEX 26.1, Oracle specifies Database 19c with release update 19.18 or later, or Oracle AI Database 26ai version 23.26.0 or later. To repeat the trace test, you also need TKPROF and access to the database host’s trace files. Run the import tests in an isolated copy: they replace the test application and clean generated files.
With the kit ready, I could compare what the two imports actually did in the database.
Looking under the hood: what the database trace showed
This is probably the most interesting finding in the article, and it was the hardest test to run. I needed access to the database server and its trace files. Most developers do not have that access, often for very good reasons. 😊 My local VM is perfect for this sort of experiment: it gives me a database and the access I need without asking anyone for the keys to a shared server.
I started with the 14-page application and used the page-cloning script to add 200 copies of page 6. From the test project’s root, the command and selected output looked like this (middle file lines omitted):
$ python scripts/apex/clone_apex_page.py 6 200
Created demo1\pages\p02001-departments-2001.apx
Created demo1\pages\p02002-departments-2002.apx
[196 file lines omitted]
Created demo1\pages\p02199-departments-2199.apx
Created demo1\pages\p02200-departments-2200.apx
That gave me 214 pages. I traced the APEXlang import first, exported the installed application as SQL so the SQL file contained those same pages, then reconnected and traced the SQL import in a fresh database session. The SQLcl sequence was:
alias load scripts/xml/stel-timing-aliases.xml
conn -n demo_vm26
@scripts/sql/apex_import_trace.sql APEXLANG
apex export -applicationid 106 -exptype SQL -dir src/database/demo1/apex_apps/f106 -overwrite-files -force
disconnect
conn -n demo_vm26
@scripts/sql/apex_import_trace.sql SQL
A piece of advice from an Oracle 7.3-certified DBA
There are other ways to investigate performance and look under the hood of an Oracle session, but I still reach for TKPROF. We have been working together since my Oracle 7.3 certification days, nearly 30 years ago. 🙂
The trace helper printed the path to each trace file on the database host, under /opt/oracle/diag/rdbms/free/FREE/trace/ in my VM. Oracle can split a trace into multiple files; this APEXlang trace came in two pieces. The _1.trc file was written first, so I combined the pieces in that order with cat before running TKPROF:
[oracle@vbox ~]$ cd /opt/oracle/diag/rdbms/free/FREE/trace/
[oracle@vbox trace]$ cat FREE_ora_6727_APEX106_APEXLANG_600P_20260914_1.trc FREE_ora_6727_APEX106_APEXLANG_600P_20260914.trc > APEX106_APEXLANG_COMPLETE.trc
[oracle@vbox trace]$ tkprof APEX106_APEXLANG_COMPLETE.trc apex106_apexlang_complete.prf sys=no aggregate=yes waits=yes
TKPROF: Release 23.0.0.0.0 - Development on Thu Sep 17 15:45:37 2026
[oracle@vbox trace]$ ls -lt apex106_apexlang_complete.prf
-rw-rw-r--. 1 oracle oracle 4611424 Sep 17 15:45 apex106_apexlang_complete.prf
aggregate=yes groups repeated executions of the same statement, and waits=yes retains wait information. The generated .prf file is much easier to read than the raw trace. You can inspect the saved APEXlang TKPROF report and SQL TKPROF report yourself; the local VM import log shows the broader timing runs. The full technical article has longer report excerpts.
One naming wrinkle: the saved trace filenames contain a 600P label, but I counted 214 page-creation statements in each report. The comparison below uses the contents of those reports, not the old filename label.
TKPROF separates the commands SQLcl sent to the database from the extra SQL the database ran while handling them. I call the first group foreground and the second recursive in this shortened comparison of the 214-page traces:
| TKPROF metric, 214-page import | APEXlang import | SQL import |
|---|---|---|
| Foreground parse calls | 51 | 265 |
| Foreground execute calls | 52 | 266 |
| Foreground fetch calls | 8 | 3 |
| All foreground calls | 111 | 534 |
SQL*Net message to client events |
52 | 265 |
SQL*Net message from client events |
52 | 265 |
| Foreground CPU | 1.35 s | 2.24 s |
| Foreground elapsed | 1.96 s | 5.88 s |
| Recursive parse calls | 4,879 | 626 |
| Recursive execute calls | 15,097 | 6,466 |
| Recursive fetch calls | 9,297 | 1,448 |
| All recursive calls | 29,273 | 8,540 |
| All foreground and recursive calls | 29,384 | 9,074 |
| Recursive CPU | 9.46 s | 1.05 s |
| Recursive elapsed | 14.00 s | 1.99 s |
| Approximate database-accounted SQL elapsed | 15.96 s | 7.87 s |
The first contrast is on the wire. During the SQL import, SQLcl runs the exported file’s application-component statements one by one. For the APEXlang import, SQLcl compiles APEXlang source into larger SQL statements and sends fewer, larger pieces of work. The trace recorded 52 versus 265 server-to-client message events: about 5.1 times fewer for APEXlang. That gives network delay fewer chances to add to the total. It is a strong clue, although this local trace alone cannot tell us how much time a particular VPN adds.
The second contrast is inside the database. Both imports call familiar proprietary APEX routines that create pages and components. APEXlang also has to create component IDs and resolve references that the generated SQL export already contains. In its TKPROF report, I found wwv_imp_util.create_id 2,225 times and wwv_imp_util.get_reference_id 3,966 times; neither appears in the SQL import report. That helps explain the many extra recursive calls. The overall database call total was about 3.2 times higher for APEXlang.
That extra work matters when SQLcl is close to the database and network trips are relatively cheap. In these traces, APEXlang used about 3.3 times the database SQL CPU and roughly twice the database-accounted SQL elapsed time. The complete traced imports took 37 seconds for APEXlang and 12 for SQL on my local VM. Those are single traced runs, separate from the repeated benchmarks later in this post; TKPROF’s SQL elapsed totals are also not whole-import times. Still, the load profiles explain why SQL can win locally even though APEXlang sends fewer requests.
Does an APEXlang import need ORDS?
A little deployment urban legend came up with colleagues: because ORDS handles APEXlang in App Builder, SQLcl must need ORDS for an APEXlang import too. The SQLcl documentation says that apex import compiles APEXlang input and executes the resulting PL/SQL through the current database connection. ORDS is not in that path. But with all this going on, who can trust documentation alone? 😊
So I checked on my local VM. I imported the same 214-page application once with ORDS running and once with it stopped. Both imports succeeded. The database traces showed the same 69 top-level PL/SQL blocks and the same 2,225 appearances of wwv_imp_util.create_id. The import work visible in those traces looked much the same with ORDS on or off.
Deployment note: If you want to be sure nobody can access an application through ORDS while it is changing, you can stop the ORDS service that serves it and still import its APEXlang files with SQLcl. Keep the database connection available to SQLcl, and handle any other access paths separately.
When the network changed the winner
The database trace was probably the most interesting test for me. This one is the most practical: it brings the pieces together and tells me which import I would try for a real deployment. I ran both imports as the application grew, first near a database and then across a VPN. The answer changed.
How I ran the comparison
I used three paths from SQLcl to a database:
| Where SQLcl ran | Where it imported the application |
|---|---|
| My Windows workstation | Database in a local VM on that workstation |
| My Windows workstation | OCI database reached through a VPN |
| An Oracle Linux workstation in OCI | The same OCI database, with SQLcl much closer to it |
That last pair is especially useful: I could change where SQLcl ran while keeping the destination database the same. The local VM gave me another point of comparison. It had two CPUs and 3.82 GiB of memory, while the OCI database had four CPUs and 31.06 GiB. Those resource figures describe the systems; I did not measure their resource use during each import.
I started with the same 14-page application for every path. My page-cloning script then set the number of extra copies of page 6 to 0, 10, 50, 100, 200, or 300, giving me applications of 14, 24, 64, 114, 214, and 314 pages. At each size, the runner imported APEXlang once to warm it up, then exported the installed application as a SQL file so the two formats contained the same pages. It warmed up the SQL import as well. Each import replaced the same application in the workspace; pages did not pile up in the database from one run to the next.
After those warm-ups, I measured APEXlang then SQL, and then reversed the order: SQL then APEXlang. I averaged those two measured imports for each method and page count. Reversing the order meant neither format always went first. The diagram shows the cycle:
From the extracted test project’s root, my local VM run started with this command:
$ scripts/run_apex_timing_test.sh demo_vm26 demo1
The runner connects with the saved SQLcl connection, selects the APEX workspace, loads the timing aliases, and calls the main SQL script. That script runs the same step at each target number of cloned pages:
@@apex_timing_test_step.sql 0
@@apex_timing_test_step.sql 10
@@apex_timing_test_step.sql 50
@@apex_timing_test_step.sql 100
@@apex_timing_test_step.sql 200
@@apex_timing_test_step.sql 300
I kept the full SQLcl and page-cloning output from each setup. You can inspect the local VM log, VPN log, and OCI workstation log. The averages below come from the second and third import of each method at every size; the first was the warm-up.
The timing results
Here are the mean import times in seconds. Lower is faster. I use these short labels in the column names:
-
VM: SQLcl on my workstation connecting to the local VM.
-
VPN: SQLcl on the same workstation connecting to the OCI database through the VPN.
-
Near OCI: SQLcl on the OCI workstation connecting to that same OCI database.
| Total pages | VM APEXlang | VM SQL import | VPN APEXlang | VPN SQL import | Near OCI APEXlang | Near OCI SQL import |
|---|---|---|---|---|---|---|
| 14 | 2.0 s | 2.0 s | 5.5 s | 9.0 s | 1.5 s | 2.0 s |
| 24 | 2.0 s | 1.5 s | 5.0 s | 8.5 s | 1.0 s | 2.0 s |
| 64 | 2.5 s | 2.5 s | 9.5 s | 14.0 s | 3.0 s | 2.0 s |
| 114 | 4.5 s | 3.5 s | 15.5 s | 27.0 s | 3.5 s | 2.5 s |
| 214 | 8.0 s | 5.5 s | 21.0 s | 27.5 s | 9.0 s | 4.0 s |
| 314 | 11.5 s | 8.5 s | 35.0 s | 56.0 s | 14.5 s | 5.5 s |
The 314-page rows show exactly how those means arose. Over the VPN, the two measured APEXlang imports took 35 and 35 seconds; SQL took 52 and 60, averaging 56. Near the same OCI database, APEXlang took 18 and 11 seconds, averaging 14.5; SQL took 6 and 5, averaging 5.5. These are small samples, but the reversal between the two client paths is hard to miss.
The chart makes the change across application sizes easier to see. Colour identifies the client path; solid lines are APEXlang imports, dashed lines are SQL imports.
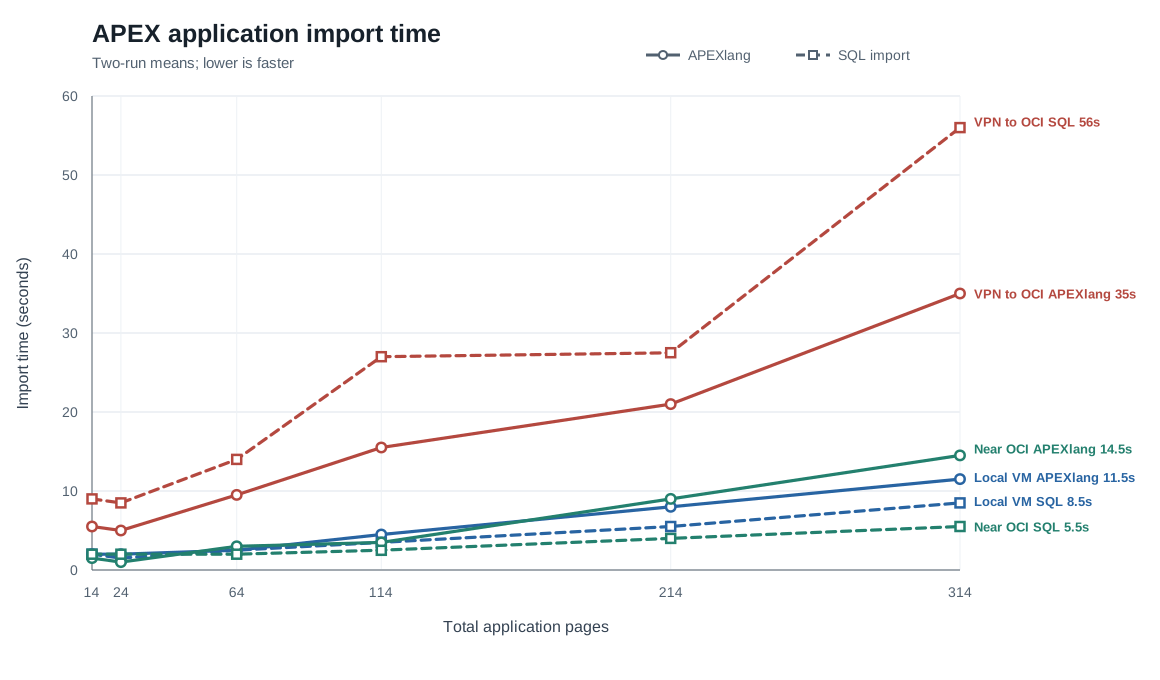
Average of two measured imports per method and application size. Lower is faster.
What changed the winner
Over the VPN, APEXlang was faster at all six application sizes. At 314 pages, it took 35 seconds, compared with 56 seconds for the SQL import. The trace result now makes practical sense: APEXlang’s fewer exchanges give the network fewer opportunities to slow it down.
And the Oscar goes to…
Network path. Both imports slowed when I moved SQLcl from the OCI workstation near the database to my workstation across the VPN. At 314 pages, SQL import went from 5.5 to 56 seconds; APEXlang went from 14.5 to 35 seconds. Moving the client made the largest difference I observed.
Database capacity. With SQLcl close to each database, my small local VM kept up surprisingly well with the much more powerful OCI database. At 214 pages, APEXlang took 8 seconds on the VM and 9 near OCI; SQL took 5.5 and 4 seconds. Across the application sizes I tested, the difference in database resources had far less impact than the client path.
APEXlang or SQL? SQL import sends more separate requests, while APEXlang groups work into fewer, larger requests. Over the VPN, APEXlang won at every size I tested. Its largest saving was 21 seconds at 314 pages. If SQLcl must deploy over a slow path, APEXlang is the option I would test first.
Finding the price of APEXlang compilation
The import timing logs left me with a small mystery. The first APEXlang import at a given application size was often slower than the next two. SQL import sometimes showed a bump too, but it was usually smaller. Here are the 14-page and 314-page cycles from the three client paths, with the first run followed by the two repeats. The 14-page cycle started in a fresh SQLcl session; the 314-page cycle came after all the smaller sizes in that same session. All times are in seconds, and a negative change means the next run was faster.
APEXlang import
| Client path | Pages | First | Second | Third | Change 1→2 | Change 2→3 |
|---|---|---|---|---|---|---|
| VM | 14 | 13 s | 2 s | 2 s | −11 s | 0 s |
| VPN | 14 | 22 s | 6 s | 5 s | −16 s | −1 s |
| Near OCI | 14 | 18 s | 2 s | 1 s | −16 s | −1 s |
| VM | 314 | 21 s | 12 s | 11 s | −9 s | −1 s |
| VPN | 314 | 38 s | 35 s | 35 s | −3 s | 0 s |
| Near OCI | 314 | 21 s | 18 s | 11 s | −3 s | −7 s |
SQL import
| Client path | Pages | First | Second | Third | Change 1→2 | Change 2→3 |
|---|---|---|---|---|---|---|
| VM | 14 | 4 s | 2 s | 2 s | −2 s | 0 s |
| VPN | 14 | 13 s | 10 s | 8 s | −3 s | −2 s |
| Near OCI | 14 | 3 s | 2 s | 2 s | −1 s | 0 s |
| VM | 314 | 12 s | 9 s | 8 s | −3 s | −1 s |
| VPN | 314 | 50 s | 52 s | 60 s | +2 s | +8 s |
| Near OCI | 314 | 11 s | 6 s | 5 s | −5 s | −1 s |
Across all six sizes and three client paths, the first APEXlang import was slower than both repeats in 16 of 18 cycles. For SQL import, that happened in 11 of 18; the 314-page VPN SQL run even got slower on repeat. The size of the bump differed too: SQL’s first-to-second gain was usually only a few seconds and never more than 5 seconds, while APEXlang’s was 11 to 16 seconds in the three 14-page rows and still 9 seconds at 314 pages on the VM. That stronger APEXlang pattern made me suspect work in SQLcl’s compiler, rather than a warm-up cost shared by both imports. But the imports run different database work, so these timings alone could not tell me where the bump occurred.
To investigate that bump, I tried to break the elapsed import time into parts I could reason about: compilation and validation in SQLcl, time across the network, and work in the database. That gave me the rough formula below. It is not a stopwatch breakdown, but the test with 200 cloned pages (214 pages total) later gave it a surprisingly useful reality check: the two parts I could measure came close to the full import time.
My very approximate timing formula ©
APEXlang import time ≈
SQLcl compilation and validation
+ network time
+ database timeNo, it is not E = mc², but for an APEX developer planning a deployment, it might be more useful. 😊
TKPROF had already given me an approximate database SQL time. Network time was harder to measure independently, so I went after the local SQLcl part. Fortunately, SQLcl has apex validate. It compiles and checks APEXlang files even when I start SQLcl with sql -nolog, without a database connection. That let me time compilation and validation without database work or network exchanges. It does not isolate compiler CPU time alone, but it makes the comparison much cleaner. The toolkit section above shows the shell timer I used around that command.
I ran two orders in separate, fresh SQLcl processes. One went from 14 to 314 to 614 total pages; the other visited the same sizes in reverse. Within each process, I validated each size three times before moving to the next, keeping SQLcl open for all nine validations. From the extracted test project’s root, these were the commands:
$ scripts/run_apex_validate_nolog.sh 0 300 600
$ scripts/run_apex_validate_nolog.sh 600 300 0
The arguments are the numbers of cloned pages added to the 14-page base application. The runner captured the smallest-first log and largest-first log. Here are their elapsed times in seconds:
| Order | Total pages | First validation | Second | Third | Three-run total |
|---|---|---|---|---|---|
| Smallest first | 14 | 12 s | 1 s | 1 s | 14 s |
| Smallest first | 314 | 14 s | 9 s | 9 s | 32 s |
| Smallest first | 614 | 29 s | 23 s | 22 s | 74 s |
| Smallest-first total | 120 s | ||||
| Largest first | 614 | 59 s | 31 s | 30 s | 120 s |
| Largest first | 314 | 11 s | 10 s | 11 s | 32 s |
| Largest first | 14 | 1 s | 0 s | 1 s | 2 s |
| Largest-first total | 154 s |
The 0 s entry means two whole-second timestamps fell in the same second, not that validation took no time. The chart plots the nine validations in the order they actually ran, so you can see when each new size arrived:
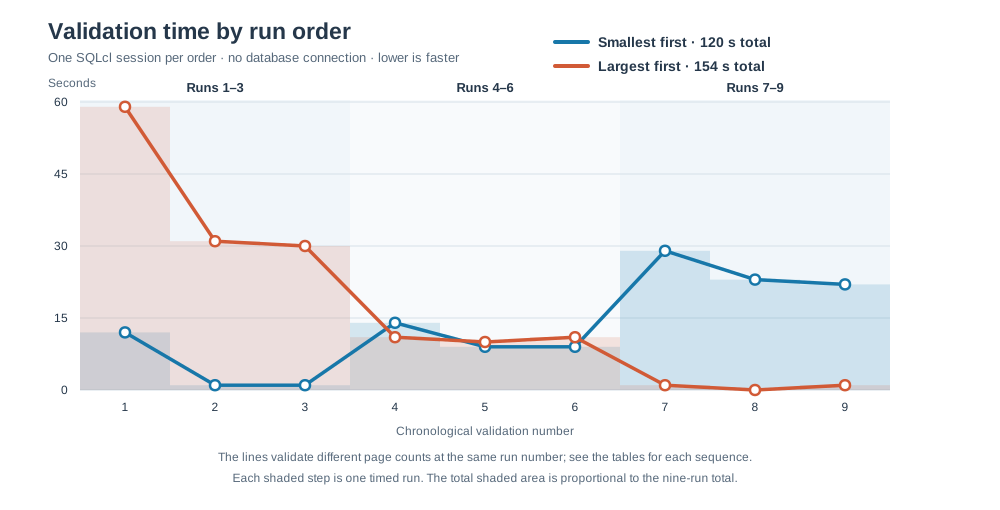
Each line covers three validations at each of the same three application sizes. The sizes arrive in opposite orders.
The first validation in a fresh process took 12 seconds for 14 pages or 59 seconds for 614 pages. Repeats were faster. Growing to the next size brought another bump; shrinking did not. A third run, from 214 to 114 to 314 pages, showed the same pattern: 23, 5, and 5 seconds at 214 pages, then 3, 3, and 2 at 114, then 12, 7, and 7 after growing to 314. SQLcl appears to retain and reuse resources for APEXlang compilation within a process, adding more when it meets a larger application. I did not measure memory allocation directly, so that is an explanation suggested by the timing pattern rather than a measurement of how SQLcl manages memory.
The 214-page run also gives my rough formula a reality check. Its first disconnected validation took 23 seconds; the database trace of a separate APEXlang import recorded about 15.96 seconds of database SQL elapsed time; the whole traced import took 37 seconds. The first two figures add to roughly 39 seconds, close to the observed import time. They come from separate runs, and validation is not pure compiler time, so this is a useful mental model rather than a way to calculate an import down to the second.
What the compiler test taught me
My rough formula passed a useful reality check on the local VM, where SQLcl and the database were close. Validation time plus database SQL time came close to the complete import time. It is an approximation, but it shows that work inside SQLcl can be a significant part of an APEXlang import. If deployment is slow despite a good network and a healthy database, the computer running SQLcl deserves attention. I have not tested whether CPU, memory, or I/O is the limiting factor.
The disconnected test made the first-run penalty much clearer. Every increase in application size we tested brought a bump on its first validation; decreasing the size brought no comparable bump. SQLcl appears to build up and reuse compiler resources within a process, though I did not measure those allocations directly. Validating the applications smallest first took 120 seconds versus 154 seconds largest first, a 22% saving.
In a SQLcl Project deployment,
dist/releases/apex/apex.changelog.xmlsets the APEX application order within one SQLcl run. I do not know of a parallel-degree setting for APEXlang imports inside that deployment, so I would put the smaller applications first in that file. Outside SQLcl Project, parallel SQLcl sessions can be a good choice for total elapsed time. Each process still has to establish its own compiler state and pay the first-run cost, so weigh that against the reuse you can get in one session.
Acknowledgements
Thank you to my colleague Fekrat El Wehedi for helping with this investigation by arranging access to the OCI workstation I used in these tests.
Conclusions and recommendations
An APEXlang import has three parts: compilation and validation in SQLcl, network exchanges, and database work. SQL import has two: network exchanges and database work. It runs the SQL export without an APEXlang compilation and validation step. SQL import sends more separate requests, while APEXlang shifts more work into the database. That balance lets the network path change the winner, and it makes the computer running SQLcl an important part of APEXlang deployment time.
Recommendations based on the tests
- If SQLcl runs close to the database, consider importing the SQL export file, especially for a larger application. At 314 pages, the SQL import took 5.5 seconds near the OCI database, versus 14.5 seconds for the APEXlang import.
- If SQLcl must connect over a slower route, try APEXlang. Across my VPN, it won at every tested size; at 314 pages, it took 35 seconds versus 56 seconds for SQL.
- If database load matters, consider SQL import for a very large application or several imports running in parallel. In the 214-page trace, APEXlang made about 3.2 times as many database calls and used about 3.3 times as much SQL CPU. Its report shows thousands of ID-generation and reference lookups absent from the SQL import report.
- If SQLcl Project deploys several APEXlang applications, put smaller ones first in
dist/releases/apex/apex.changelog.xml. The deployment runs in one SQLcl invocation, where compiler work can be reused. Smallest first saved 22% in my validation test. Outside Project, parallel sessions may shorten the batch, but each process pays its own first-run cost. - If you need the application unavailable through ORDS during deployment, you can stop ORDS. SQLcl’s APEXlang import still works through its database connection.
Try it with your application
These are choices to test in your environment; there is no universal network threshold. The test kit lets you repeat the comparison with your application and network path. Please feel free to download it from the links in Sources below, use it, and modify it to suit your needs. If you get different results, contact me or share them through the discussion link below.
Sources
My repository and test material
- Full APEXlang versus SQL deployment performance investigation
- APEXlang versus SQL test project, scripts, and logs
- Downloadable APEXlang versus SQL test kit
- APEXlang import TKPROF report
- SQL import TKPROF report
- Local VM import timing log
- VPN import timing log
- OCI workstation import timing log
- Smallest-first disconnected validation log
- Largest-first disconnected validation log
- Intermediate-size disconnected validation log
Oracle documentation